Construction Services

Locating Issues a Persistent Cause of Utility Damages

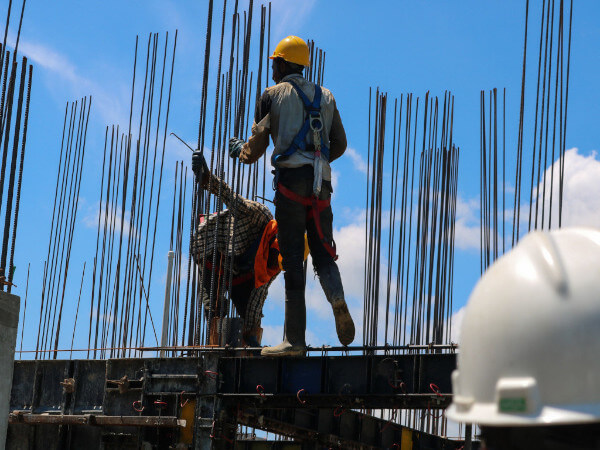
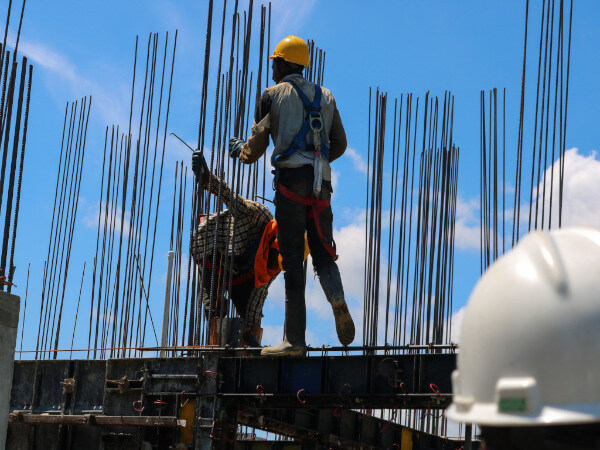
Underground utilities were damaged in an estimated 468,000 excavation-related incidents in 2020, according to the DIRT Report released last month by the Common Ground Alliance (CGA). Despite those numbers being down 12% from 2019, the industry shouldn’t pat itself on the back quite yet.

CGA says the decline in damages coincides with a 4.2% dip in construction activity during the pandemic. The overall emphasis on safety because of the global pandemic may have led to less crowded and potentially less distracting jobsites.

No locate request and poor locating practices were tied at 32%, respectively, causing 64% of the reported damages that have known root causes. Those include failure to notify 811 and facilities not marked or marked inaccurately due to locator error or the presence of an abandoned facility.

Rounding out the “big three,” poor excavation practices was the next highest cause, at 30%. Digging before verifying marks by a test hole combined with a failure to maintain clearance were the most consistent causes of damages in the field.

The pandemic triggered a steep rise in homeowner locate requests and digging activities associated with home improvement projects, whether by homeowners or professional contractors. Despite the increase in homeowner activity, damages involving occupants did not increase.

While estimated damages in the U.S. decreased in 2020, the report shows a five-year trend in damage rates that has plateaued. The 2020 DIRT Report predicts the next few years will bring an increase in construction activity and the potential of a national infrastructure program that will require the damage-prevention industry to focus on addressing the consistent rate of damages and estimated $30 billion in societal costs incurred as a result of damages to buried infrastructure each year.

The most commonly damaged utility lines were telecommunications at 50%, natural gas at 23% and cable TV at 11%.

The report also found:

June was the month with the most total damages in 2020. Wednesday was the most common day of the week that damages occurred.Backhoes topped the list of known equipment-caused damages at 15%.

“The DIRT Report is a crucial tool for understanding the most pressing challenges in damage prevention – and to truly make progress on addressing the handful of damage root causes that are driving the vast majority of damages,” said Sarah K. Magruder Lyle, president and CEO of CGA.

“With the potential of significant infrastructure legislation becoming law coupled with an expected increase in construction activity in the coming years, we must focus on the challenges outlined in the DIRT Report and work together as an industry to improve each step of the damage-prevention process.”

CGA is a nonprofit association of the underground utility industry that seeks to prevent damage to North American underground infrastructure by promoting damage-prevention practices.

Did you miss our previous article…
https://www.3555pacific.com/?p=226
Construction Management

JCB Unveils Its Tallest Telehandler, the Rotating 512-83R

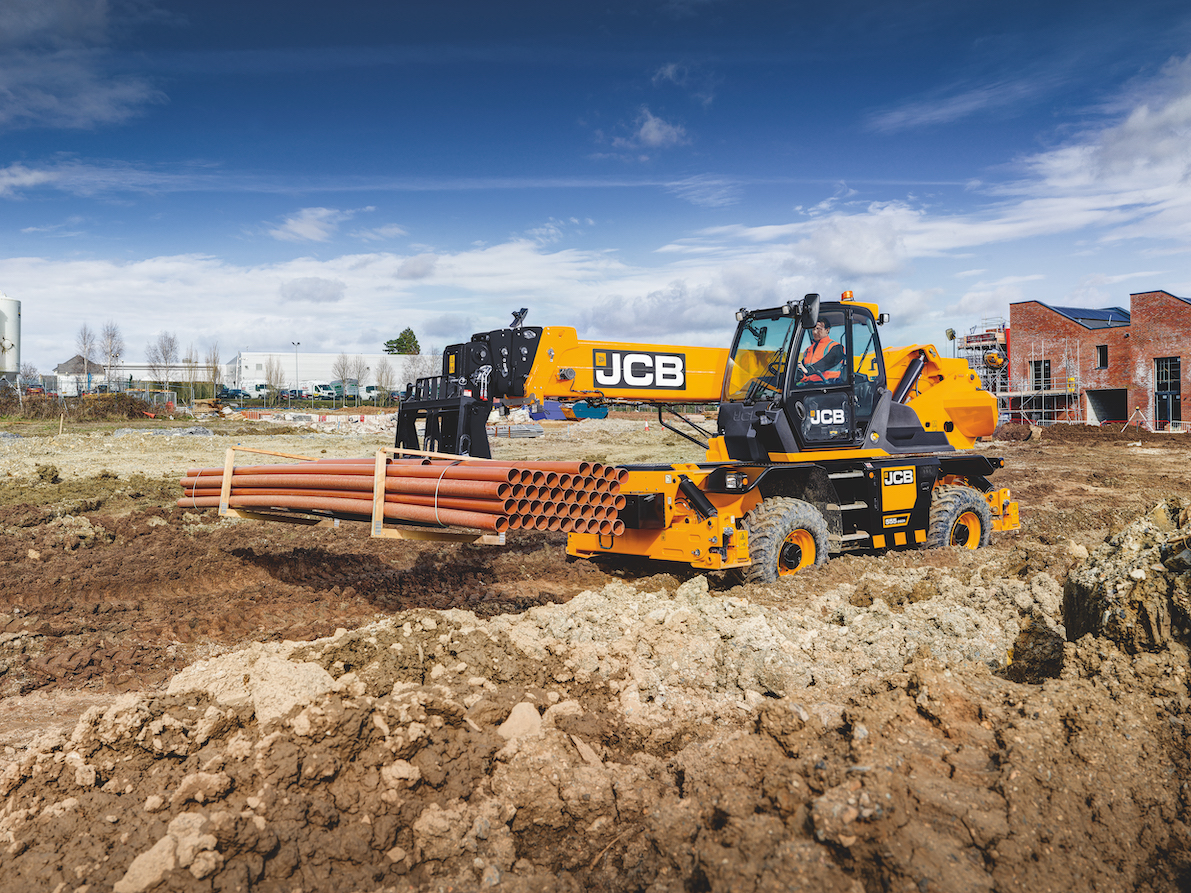
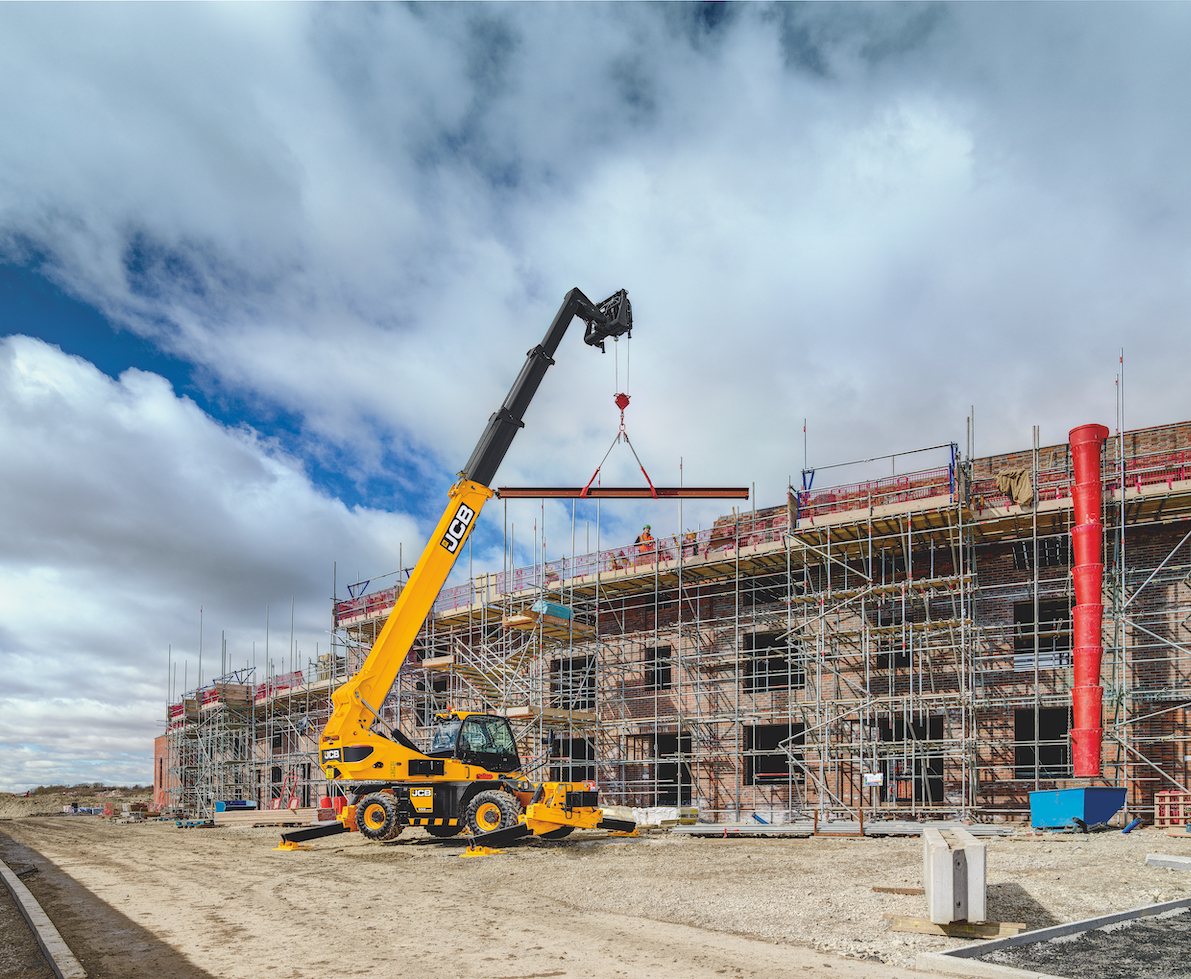
JCB is going bigger and taller with its new eight-story-high rotating telehandler, the 512-83R, which it calls three machines in one.

JCB says it can also serve as a crane or be equipped as an aerial work platform.

The telehandler has a max lift height of 83 feet and a max lift capacity of 12,000 pounds. 

The company designed the machine for the changing jobsite in which larger loads need to be lifted to greater heights. JCB has modular home and building construction in mind for the 512-83R, but also says it can be used for any construction site dealing with suspended loads. It is also designed for the rental market, with simple, intuitive controls, and can be used for infrastructure projects, such as bridge work, or in urban areas with little space.

“It’s perfect for lifting and placing materials, panels and modular components at height in a very safe way and in a very productive manner,” said Tim Burnhope, JCB chief innovation and growth officer.


The JCB 512-83R rotating telehandler can also serve as an aerial work platform.JCBThe telehandler delivers continuous 360-degree rotation and is designed for fast setup, as its outriggsers can be automatically extended in 26 seconds and retracted. “Unlike the mobile crane, the [512-83R] can be set up on the site rapidly with outriggers that can be deployed, stored and leveled at the touch of a button,” Burnhope said during the product’s online unveiling.

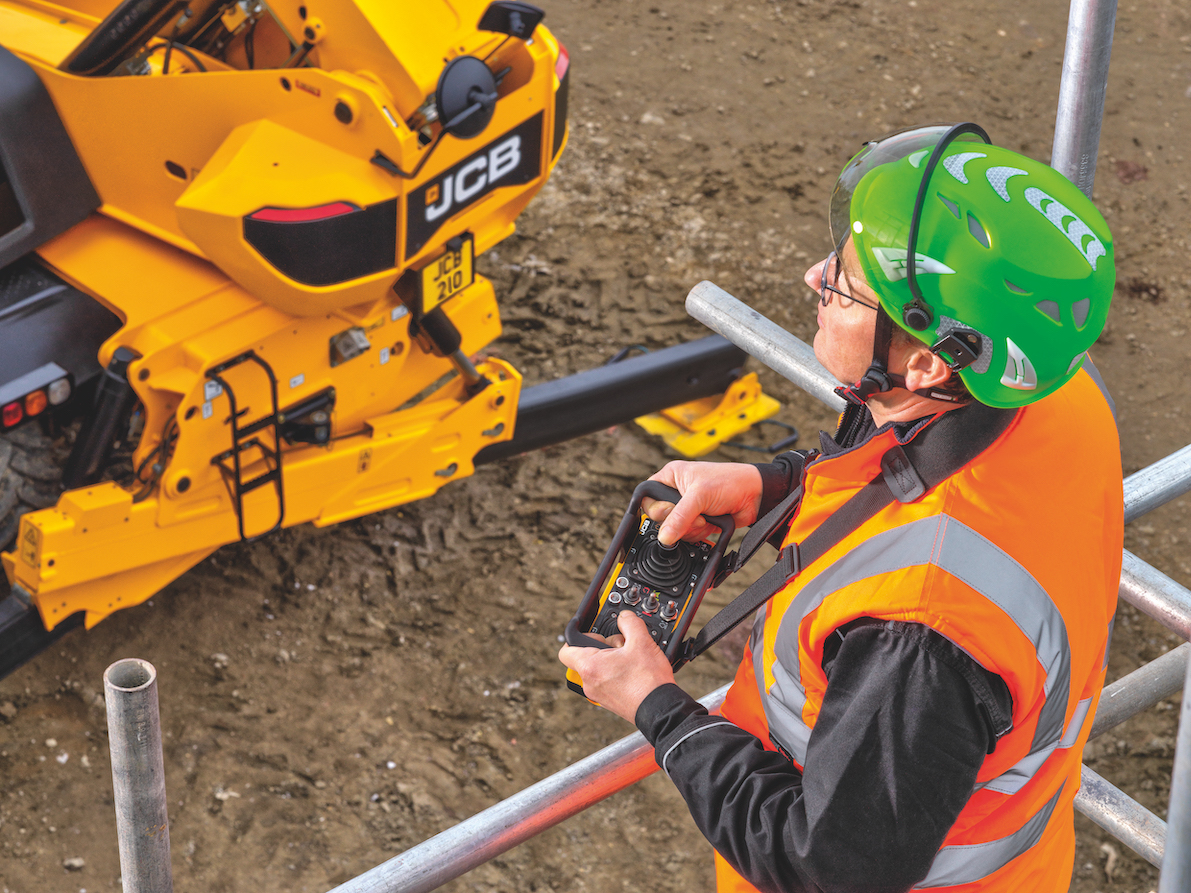
The telehandler can also be operated by remote control. 

Available attachments include pallet forks, rotating forks, winches, a lifting hook and a light-duty bucket. The attachments use radio-frequency identification, or RFID, so the correct load chart for the tool automatically pops up on the telehandler’s 7-inch screen.

JCB 512-83R rotating telehandler remote control
The JCB 512-83R rotating telehandler can be operated by remote control.JCBThe four-section boom with one telescopic cylinder has a low profile for better operator visibility. A camera can be mounted to its head, so the operator can see better when placing loads at height. The boom can lift up to 4,400 pounds to max height and up to 660 pounds at full horizontal reach, which is 70 feet.

The telehandler runs on a 145-horsepower JCB EcoMax diesel engine and a two-speed hydrostatic transmission. It can travel up to 25 mph and has three steering modes. Turning radius is under 10 feet. Four-wheel drive is available for off-road work.

JCB 512-83R rotating telehandler material handler
JCB 512-83R rotating telehandlerJCBThe engine and the machine’s service points have been placed at ground level for easy access. Service intervals are at 500 hours. Seating options are available for the cab. Work lights and camera kits are optional. A five-year subscription to JCB LiveLink telematics is standard.

JCB says it is currently taking orders for the 512-83R.

JCB 512-83R rotating telehandler lifting
JCB 512-83R rotating telehandlerJCB

Did you miss our previous article…
https://www.3555pacific.com/?p=220

Construction Services

Report: One-Fourth of Infrastructure Faces Flood Risk. (Here’s How to Check Your Area’s Threat Level.)

A new report estimates that one-fourth of all critical infrastructure in the U.S. is at risk of flooding, and that percentage will increase as storms become more severe due to climate change.

The science and technology nonprofit First Street Foundation, in what it calls “the first ever nationwide community level flood resilience report,” says state and local governments are not equipped to handle the present and future flood risks to critical infrastructure.

“As we saw following the devastation of Hurricane Ida, our nation’s infrastructure is not built to a standard that protects against the level of flood risk we face today, let alone how those risks will grow over the next 30 years as the climate changes,” says Matthew Eby, founder and executive director of First Street Foundation.

The “Infrastructure on the Brink” report says that 25% of current “critical infrastructure,” such as utilities, airports, ports, and emergency services like police, fire and hospitals, is at risk of becoming inoperable due to flooding.

It estimates these other current infrastructure flood risks:

23% of all road segments in the country (nearly 2 million miles of road). 20% of all commercial properties (919,000).17% of all “social infrastructure” facilities (72,000). This includes such properties as schools and government buildings.14% of all residential properties (12.4 million).

The risks are expected to increase through 2051.

“Over the next 30 years, due to the impacts of climate change, an additional 1.2 million residential properties, 66,000 commercial properties, 63,000 miles of roads, 6,100 pieces of social infrastructure and 2,000 pieces of critical infrastructure will also have flood risk that would render them inoperable, inaccessible or impassable,” the report says.


This chart shows the expected increase in flood risks by infrastructure category over the next 30 years.First Street Foundation’s “Infrastructure on the Brink” report

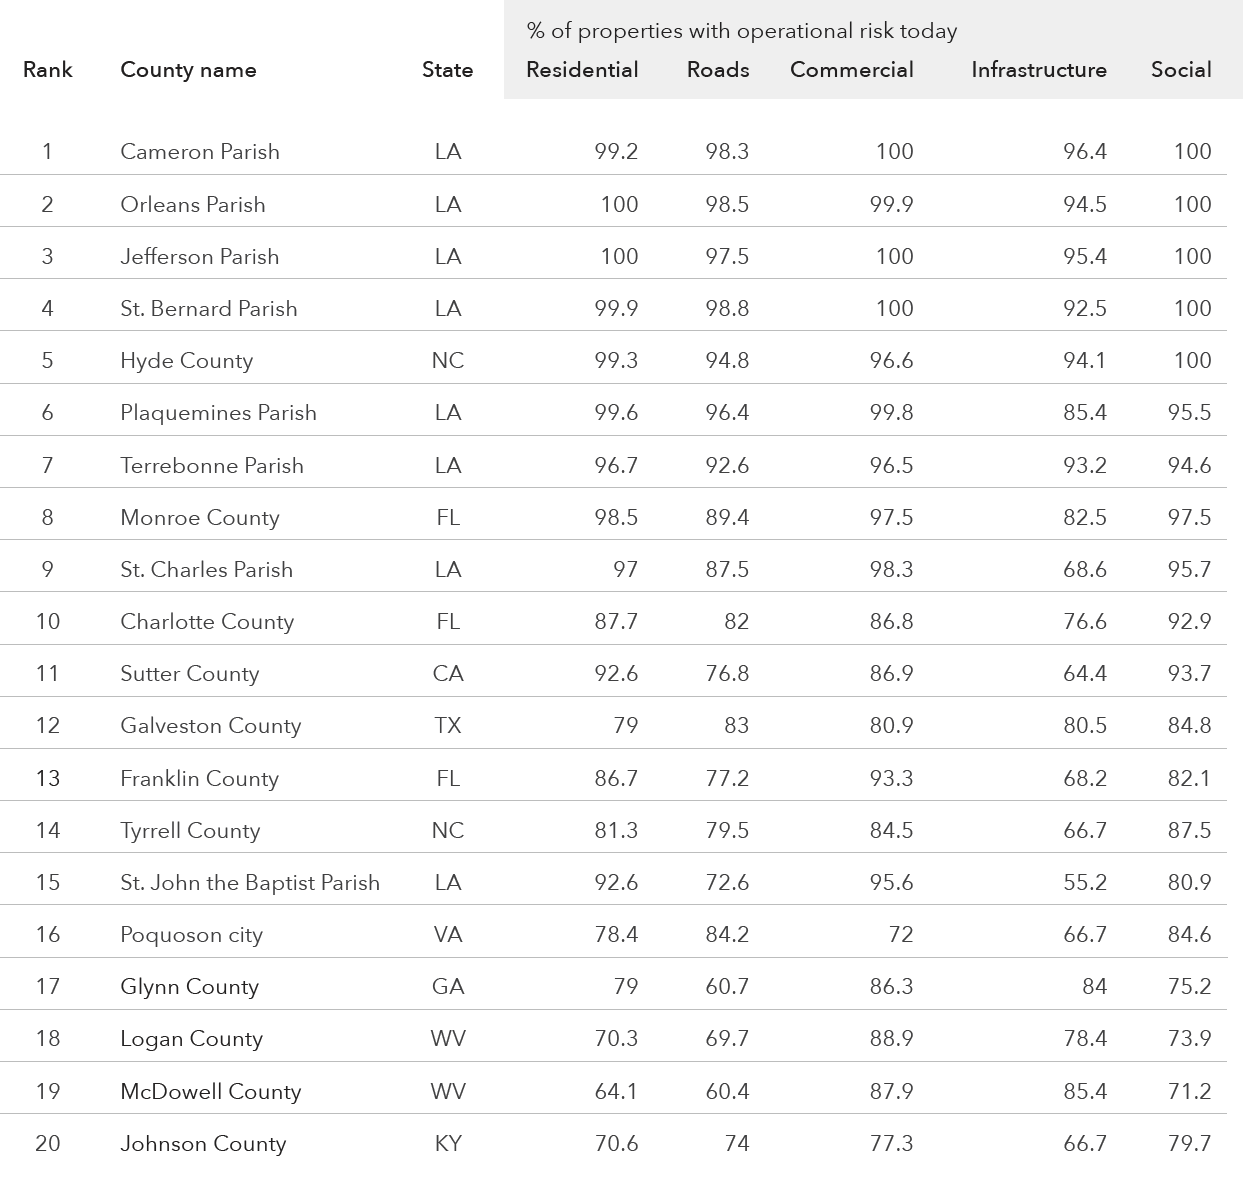
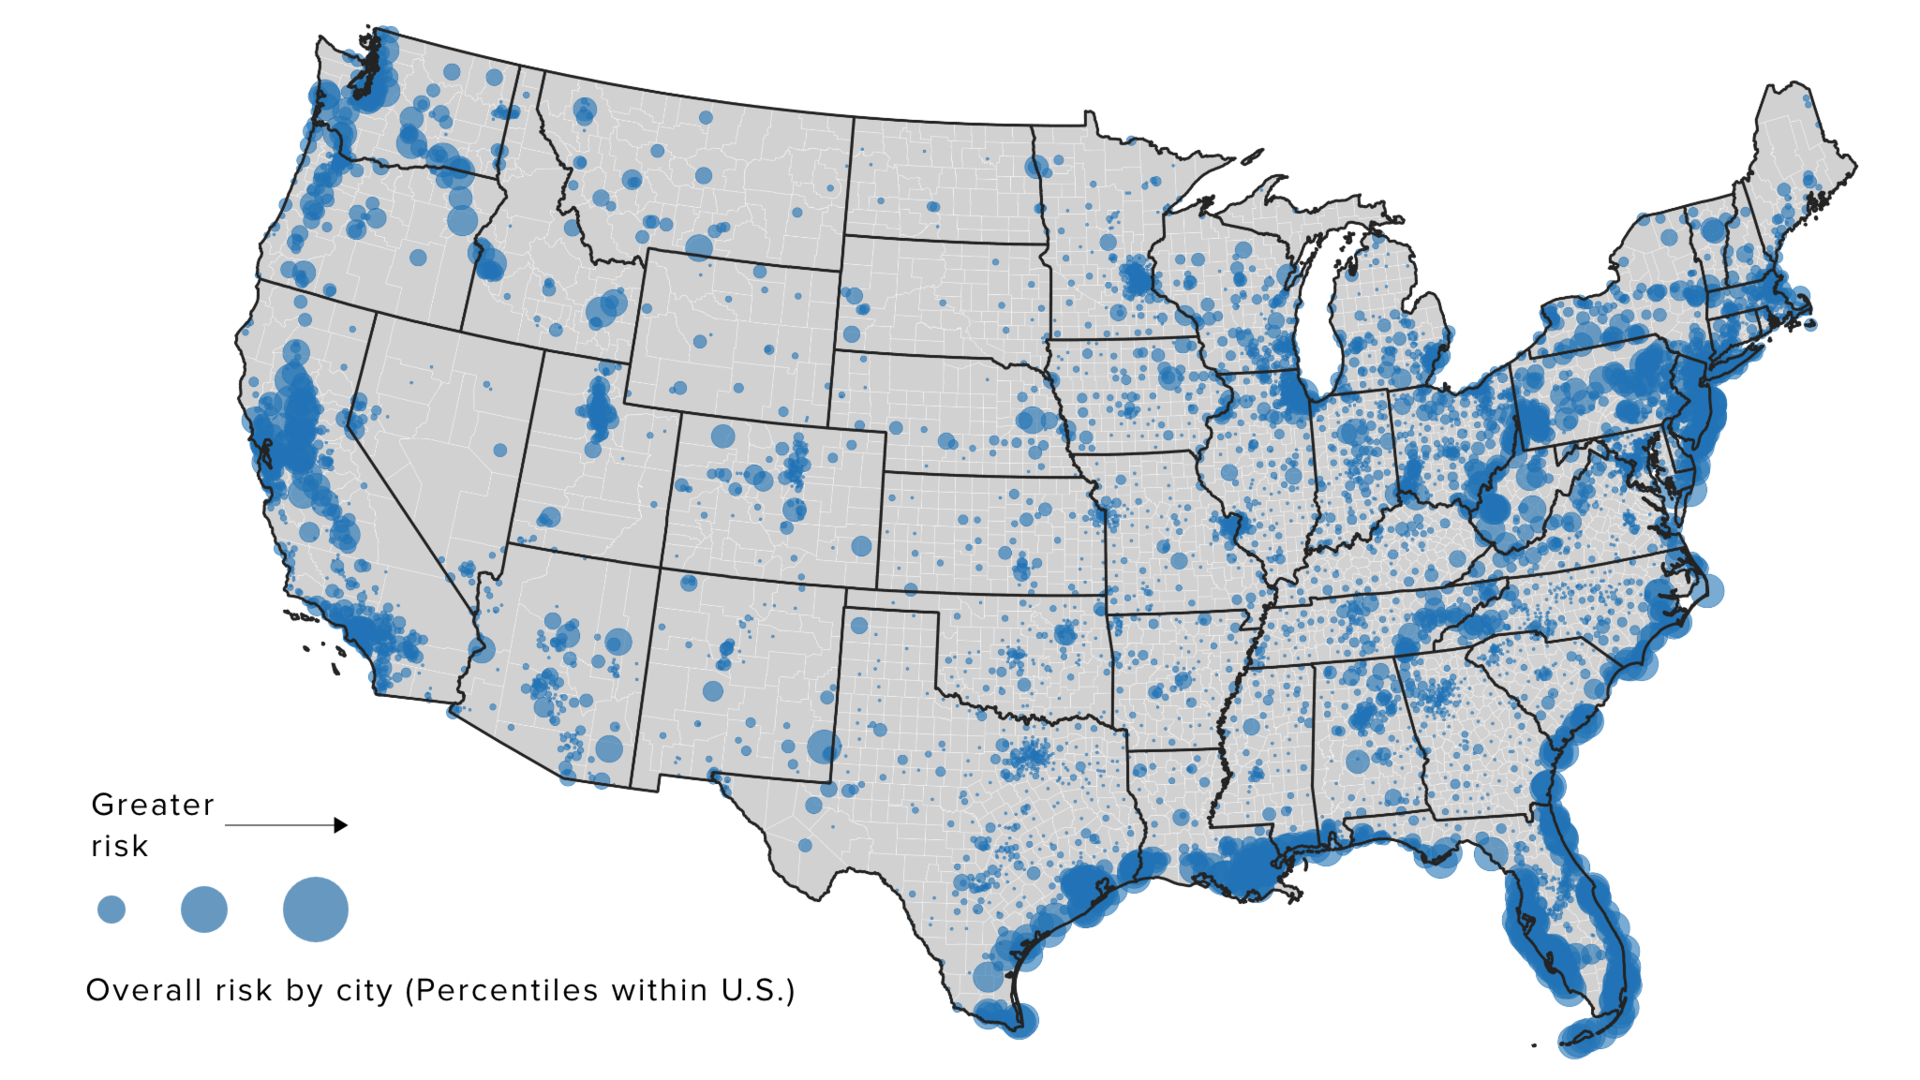
The report shows these four states facing the highest concentration of current risk: Louisiana, Florida, Kentucky and West Virginia. Of the top-20 at-risk counties in the U.S., 17 are in these four states.

The report also provides data on all at-risk cities and counties, and you can search on First Street’s website to find the flood risk for your property with the nonprofit’s free FloodFactor tool.

top-20 counties infrastructure flood risk chart
This chart shows the top-20 counties most at-risk to physical infrastructure flooding and the percentages of their infrastructure categories that are at risk. (Note: The “Infrastructure” column represents “critical infrastructure,” such as airports, fire stations, hospitals, police stations, ports, power stations.)First Street Foundation’s “Infrastructure on the Brink” report

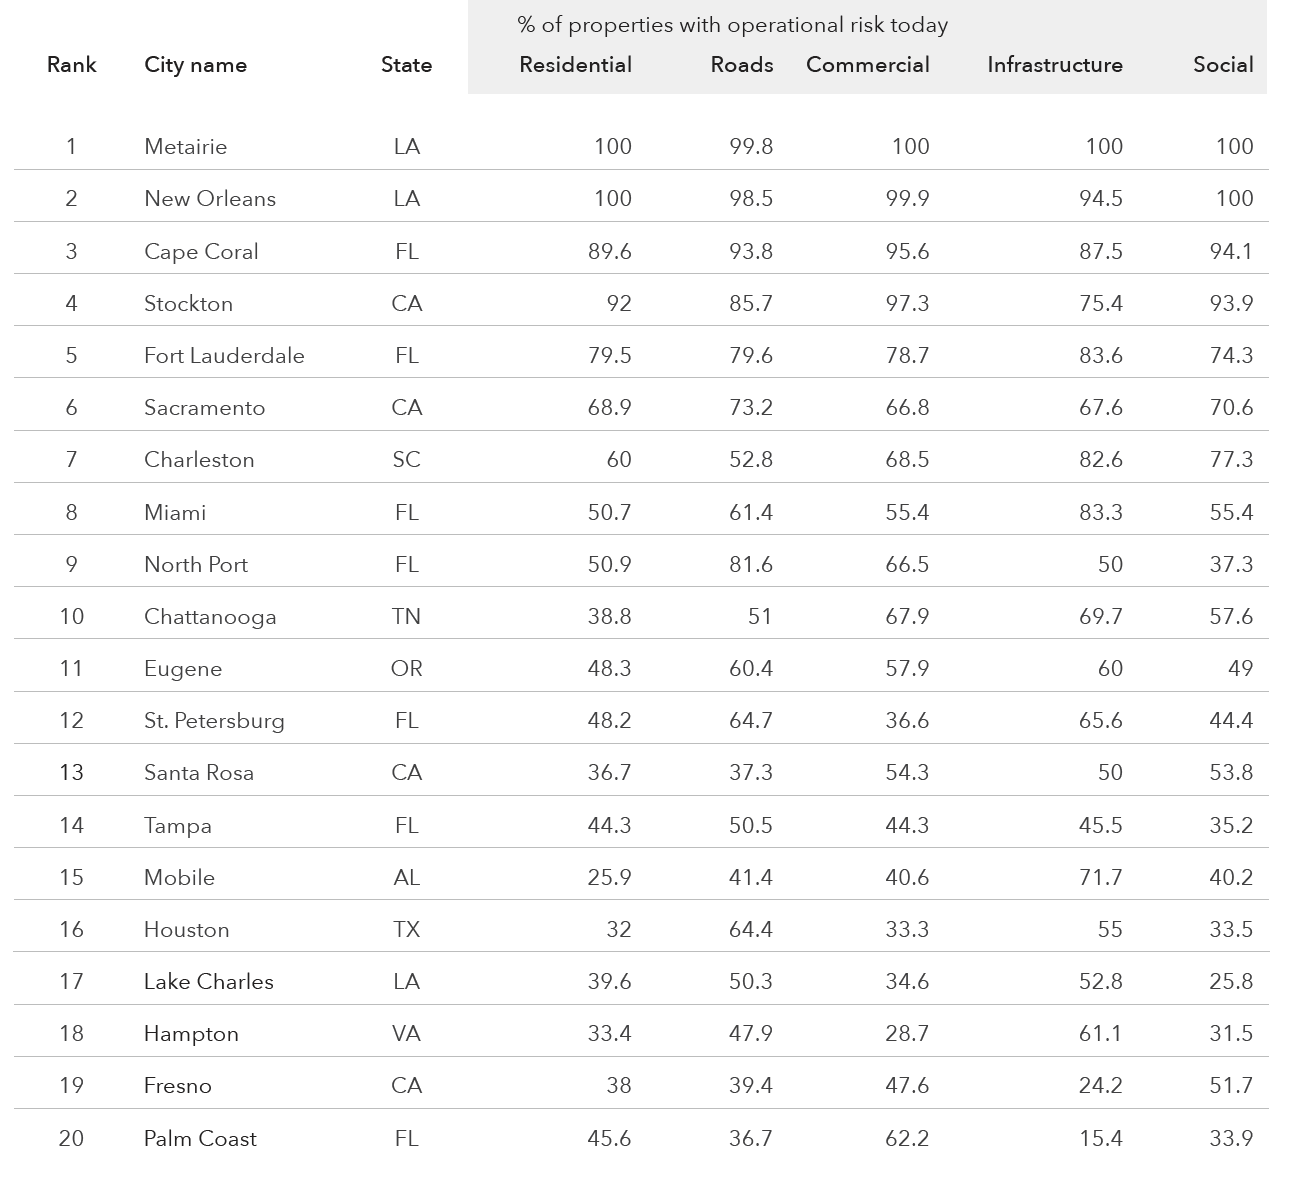
For cities facing the most flood risk today, Moliere and New Orleans, Louisiana, top the rankings, with most, if not all, of their infrastructure vulnerable. Cities in California, South Carolina, Florida and Alabama also made the list.

top-20 cities infrastructure flood risk chart
This chart shows the top-20 cities most at-risk to physical infrastructure flooding and the percentages of their infrastructure categories that are at risk. (Note: The “Infrastructure” column represents “critical infrastructure,” such as airports, fire stations, hospitals, police stations, ports, power stations.)First Street Foundation’s “Infrastructure on the Brink” report

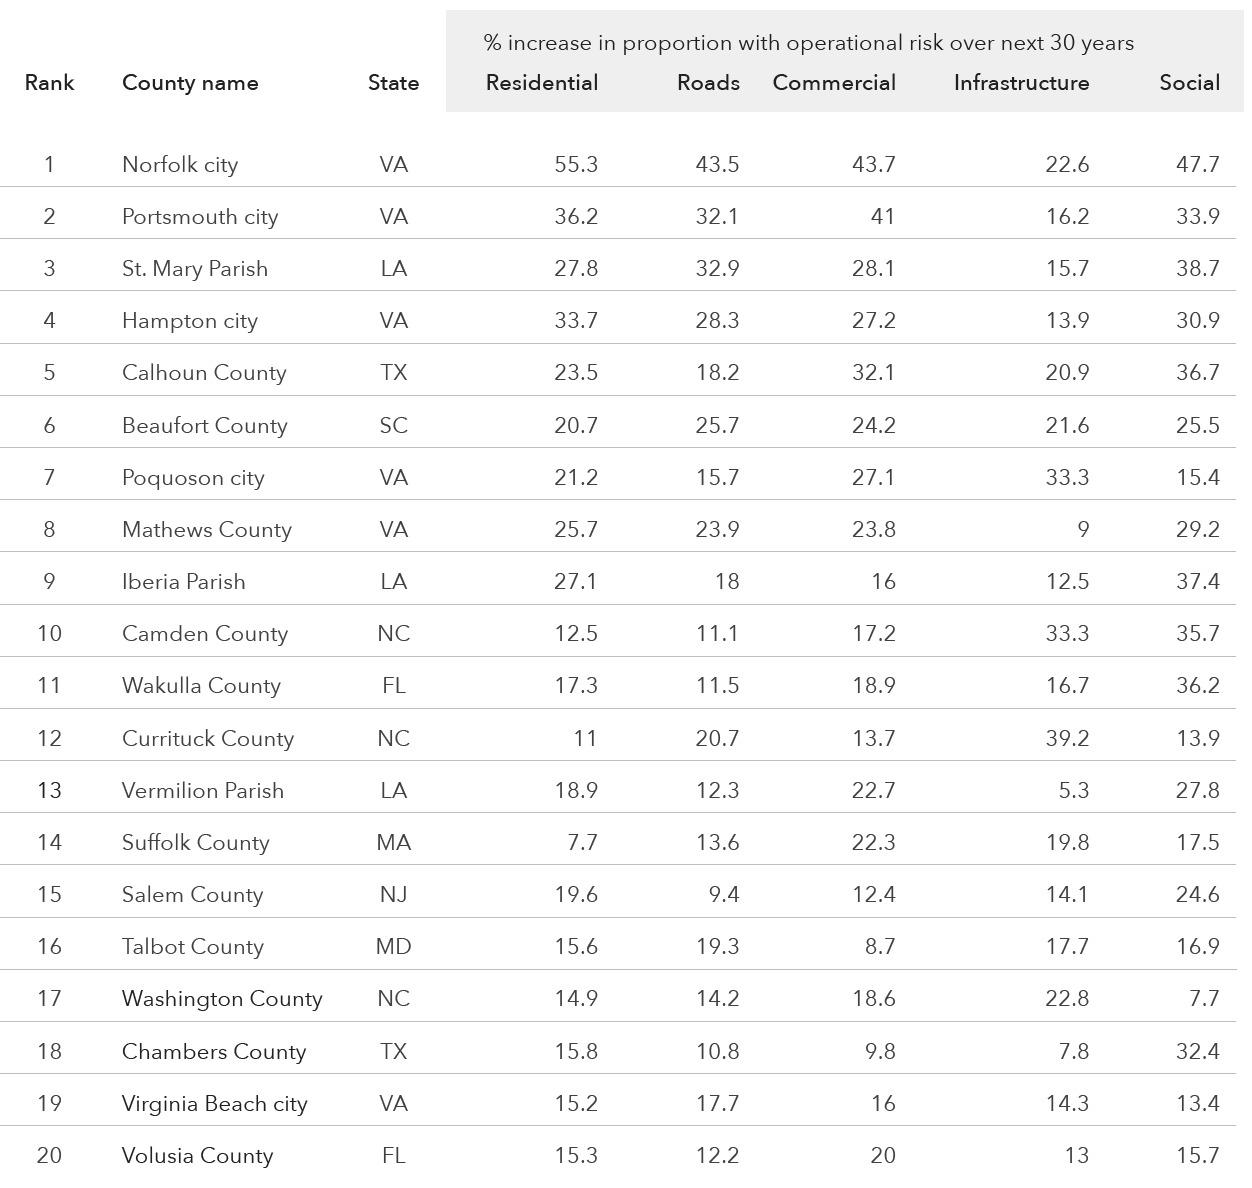
The report also looks into the future, showing which counties will see the largest percentage increase in infrastructure risk by 2051. Virginia has several metro areas facing a significantly increased threat. The list also includes counties in North Carolina, Massachusetts, Maryland and Texas.

top-20 counties increased flood risk
This chart shows the top-20 counties with the highest estimated percentage increase of risk to physical infrastructure flooding by 2051 and the percentages of their infrastructure categories that are at risk. (Note: The “Infrastructure” column represents “critical infrastructure,” such as airports, fire stations, hospitals, police stations, ports, power stations.)First Street Foundation’s “Infrastructure on the Brink” report

The report says the impact of the increased risks could devastate local communities. It notes that in Harris County, Texas, home to Houston, 770 hospitals, public utilities and water-treatment plants currently risk becoming inoperable due to flooding this year.

Miami-Dade, Florida, has 1,640 schools, churches and museums at risk. The Chicago metro area has 225,000 residential properties at risk. And in the New Orleans area, 99% of the roads are at risk of becoming undrivable because of flooding, the report says.

First Street Foundation hopes the data will help prioritize funding toward protecting infrastructure from flood risks.

“Our work aims to determine the amount of flooding that would render infrastructure either inoperable or inaccessible,” says Dr. Jeremy Porter of First Street Foundation. “By applying research on depth thresholds and comparing them to flood data and probability metrics, we can determine roughly the extent of flooding that would cause a road to be impassable to cars, or a hospital to be shut down.”

infrastructure flood risk locator map
This map shows where the greatest flood risks are to infrastructure.First Street Foundation’s “Infrastructure on the Brink” report